Russian
GNUplot Demonstrations
Contents Back Next
scatter gnuplot demo #
# Simple demo to scatter data conversion to grid data.
#
set title "Simple demo to scatter data conversion to grid data"
set nohidden3d
set ticslevel 0.5
set view 60,30
set autoscale
set parametric
set data style points
set xlabel "data style point - no dgrid"
splot "hemisphr.dat"
will result in (gif mode)

set dgrid3d 10,10,1
set xlabel " data style lines, dgrid3d 10,10,1"
set data style lines
splot "hemisphr.dat"
will result in (gif mode)

set dgrid3d ,,4
set xlabel " data style lines, dgrid3d ,,4 "
set data style lines
splot "hemisphr.dat"
will result in (gif mode)

set dgrid3d ,,16
set xlabel " data style lines, dgrid3d ,,16"
set data style lines
splot "hemisphr.dat"
will result in (gif mode)

set contour
set xlabel "data style lines, dgrid3d ,,16, contour"
splot "hemisphr.dat"
will result in (gif mode)

set nodgrid3d
set data style points
set xlabel "data style points, nodgrid3d"
splot "scatter2.dat"
will result in (gif mode)

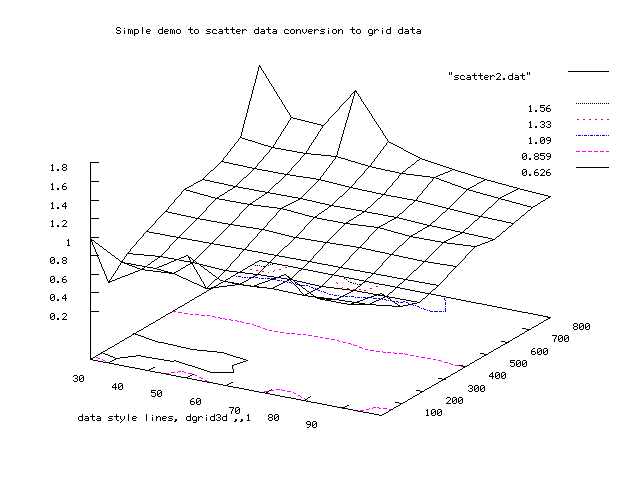
set dgrid3d ,,1
set xlabel "data style lines, dgrid3d ,,1"
set data style lines
splot "scatter2.dat"
will result in (gif mode)

set dgrid3d ,,4
set xlabel "data style lines, dgrid3d ,,4"
set data style lines
splot "scatter2.dat"
will result in (gif mode)

set noparametric
set nodgrid3d
set nocontour
set title ""
set xlabel ""
http://playfair.stanford.edu/~woo/woo.html
|
